Switchgrass Genotype Classification using Hyperspectral Imagery
Published:

The adoption of remote sensing techniques in agricultural has been proven to be time and labor efficient, which saves labor and time from otherwise tedious and time-consuming field measurements. Hyperspectral signatures have proven to be capable of material detection. Spectra for different materials are different and can be used for distinguishing different materials. However, in the problem I dealt with, the spectra of different genotypes of the same plant species are so similar that it is challenging to distinguish between them using only spectra. Additionally, large variances make them overlap...
Motivation and Goal
- The adoption of remote sensing techniques in agricultural has been proven to be time and labor efficient.
- Hyperspectral signatures have proven to be capable of material detection.
- However, the spectra of different genotypes of the same plant species are similar so it is challenging to distinguish between them using the spectra.
- A protocol for hyperspectral data processing is proposed.
- Due to the challenges in distinguishing between genotypes of the same species, whether dimensionality reduction can help in discriminating between these classes is investigated. - High correlation among hyperspectral bands – so data compression is indicated - No clear wavelength (or set of wavelengths) that easily distinguish the classes - so a non-linear dimensionality reduction method is needed
Literature Review
The Siamese Network
- A supervised dimensionality reduction method.
- Goal: “Classification-friendly” dimensionality reduction.
- Maps high dimensional input data points onto a low dimensional manifold such that “similar” pairs of inputs are mapped to nearby points on the learned manifold, whereas “dissimilar” pairs of inputs are mapped to far-away points on the manifold.
- Siamese network is a class of neural network architectures that contain two or more subnetworks.
- Applications:
- Face recognition
- Paraphrase scoring
- Signature verification<
- Network architecture:
- Pairs of inputs with a binary label.
- Contrastive loss function to deal with pairs with label 0 or 1 differently.
- Similarity score: distance measure.
- The model predict whether a pair of input data are similar in the original space by setting a threshold to the similarity score.
Mathematical Details
Contrastive Loss
Let $\overrightarrow{X_{1}}$ and $\overrightarrow{X_{2}}$ ($\overrightarrow{X_{1}}$, $\overrightarrow{X_{2}}\in{D}$) be a pair of input vectors, and Y be the binary label describing the similarity of this pair of data, i.e.
\[Y = \left\{ \begin{aligned} 0, if\ a\ similar\ pair \\ 1, if\ a\ dissimilar\ pair \end{aligned} \right.\]Output from the last layer of the Siamese Network: $G_W(\overrightarrow{X_1})$, $G_W(\overrightarrow{X_2})$ ($G_W(\overrightarrow{X_1})$, $G_W(\overrightarrow{X_2})\in {}d$)
Distance of the pair in the output space:
Contrastive loss:
\(L(W, (Y, \overrightarrow{X_1}, \overrightarrow{X_2})) = (1-Y)L_S(D_W^i) + YL_D(D_W^i)\) where
$L_S(D_W^i) = \frac{1}{2}D_W^2$
$L_D(D_W^i) = \frac{1}{2}[max(0, m-D_W)]^2$
From the definition above, we observe that the loss function treat similar pairs and dissimilar pairs of input differently:
- For similar pairs, the larger the distance, the larger the loss value.
- For dissimilar paris, the larger the distance, the smaller the loss; further, a threshold (call margin $m$) is set such that the loss becomes zero when the distance between a dissimilar pair is large enough.
Dataset and Methodology
Dataset
- Hyperspectral images collected from a switchgrass field in Columbia, Missouri using a hyperspectral camera mounted on a UAV.
- Six switchgrass genotypes are present in the field
- A plot-based stand experiment design is adopted
- A group of all the same type of switchgrass are planted in 6m x 6m plots and replicated 5 times in the field.
Methodology
Preprocessing
Radiometric calibration
Noisy band removal
Switchgrass Detection
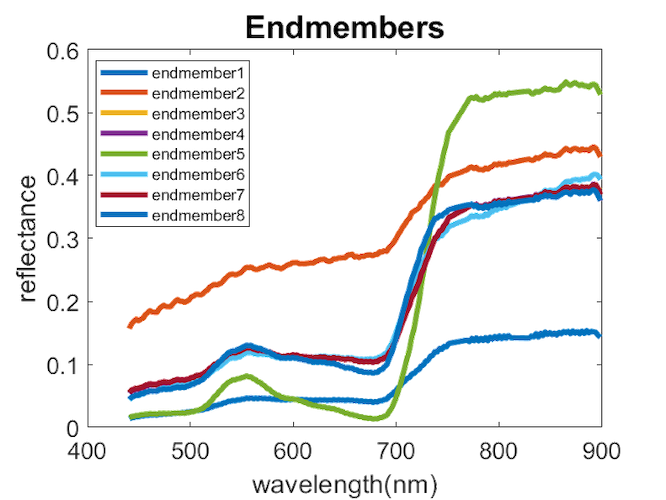
Switchgrass detection is done by hyperspectral unmixing, the algorithm I used is called Sparsity-Promoting Iterative Constrained Endmembers (SPICE).
Genotype Classification
Ground Truth Generation
Dimensionality Reduction
The Siamese Network
Principal Component Analysis (baseline method)
Linear Discriminant Analysis (baseline method 2)
Linear Discriminant Analysis (LDA) is a statistical technique for categorizing data into groups. It identifies patterns in features to distinguish between different classes. For instance, it may analyze characteristics like size and color to classify fruits as apples or oranges. LDA aims to find a straight line or plane that best separates these groups while minimizing overlap within each class. By maximizing the separation between classes, it enables accurate classification of new data points. The main goal of LDA is to project the data onto a lower-dimensional space with good class-separability in order to avoid overfitting (“curse of dimensionality”) and also reduce computational costs. LDA seeks to reduce dimensions while preserving as much of the class discriminatory information as possible. In simpler terms, LDA helps make sense of data by finding the most effective way to separate different categories, aiding tasks like pattern recognition and classification.
Cons:
- Linear decision boundaries may not effectively separate non-linearly separable classes. More flexible boundaries are desired.
- In cases where the number of observations exceeds the number of features, LDA might not perform as desired (Small Sample Size (SSS) problem). Regularization is required.
